HOCKEY STICK CONTROVERSY
The Hockey Stick Controversy refers to debates over the technical correctness and implications for global warming of graphs showing reconstructed estimates of the temperature record of the past 1000 years. At a political level, the debate is about the use of these graphs to convey complex science to the public, and the question of the robustness of the assessment presented by the Intergovernmental Panel on Climate Change (IPCC). Arguments over the graphs have been taken up by fossil fuel industry funded lobbying groups attempting to cast doubt on climate science.
By the late 1990s a number of competing teams of climate scientists were using proxy indicators to estimate the temperature record of past centuries, and finding suggestions that recent warming was exceptional. In 1998 Michael E. Mann, Raymond S. Bradley and Malcolm K. Hughes used statistical analysis of a variety of proxies to produce the first quantitative hemispheric-scale reconstruction showing global patterns of annual surface temperature. It included a graph going back to 1400, with the innovation of shading emphasising that uncertainties (to two standard error limits) were much greater in earlier centuries. Their 1999 paper using this methodology went back to 1000, with the extended graph showing a downward trend in proxy temperatures from a Medieval Warm Period followed by a 20th century rise and a steep increase in measured temperatures since the 1950s. The term hockey stick was coined by the climatologist Jerry Mahlman, to describe the pattern this showed, envisaging a graph that is relatively flat to 1900 as forming the Hockey stick's "shaft", followed by a sharp increase corresponding to the "blade".
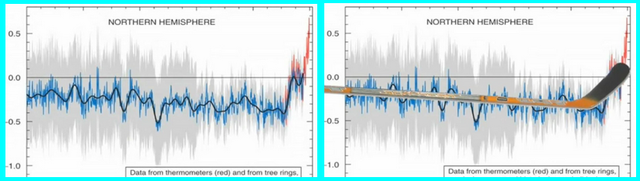
A version of this graph was featured prominently in the 2001 United Nations Intergovernmental Panel on Climate Change (IPCC) Third Assessment Report (TAR), which also drew on four other reconstructions to support the conclusion that, in the Northern Hemisphere, the 1990s was likely to have been the warmest decade and 1998 the warmest year during the past 1,000 years. The graph was featured in publicity, and became a focus of dispute for those opposed to the strengthening scientific consensus that late 20th century warmth was exceptional.

FULL INFORMATION ON THIS SUBJECT
New Study Sharpens Hockey Stick - 2013
More Global Warming Facts from
RELATED IMAGES
